How to Use the Precious Metals IRA Calculator: A Simple Guide
The Precious Metals IRA Calculator is an interactive tool to estimate potential returns from investing in gold, silver, platinum, or palladium IRAs. It uses 2025-2026 market trends for projections and compares with traditional investments. Here’s a step-by-step guide to using it.
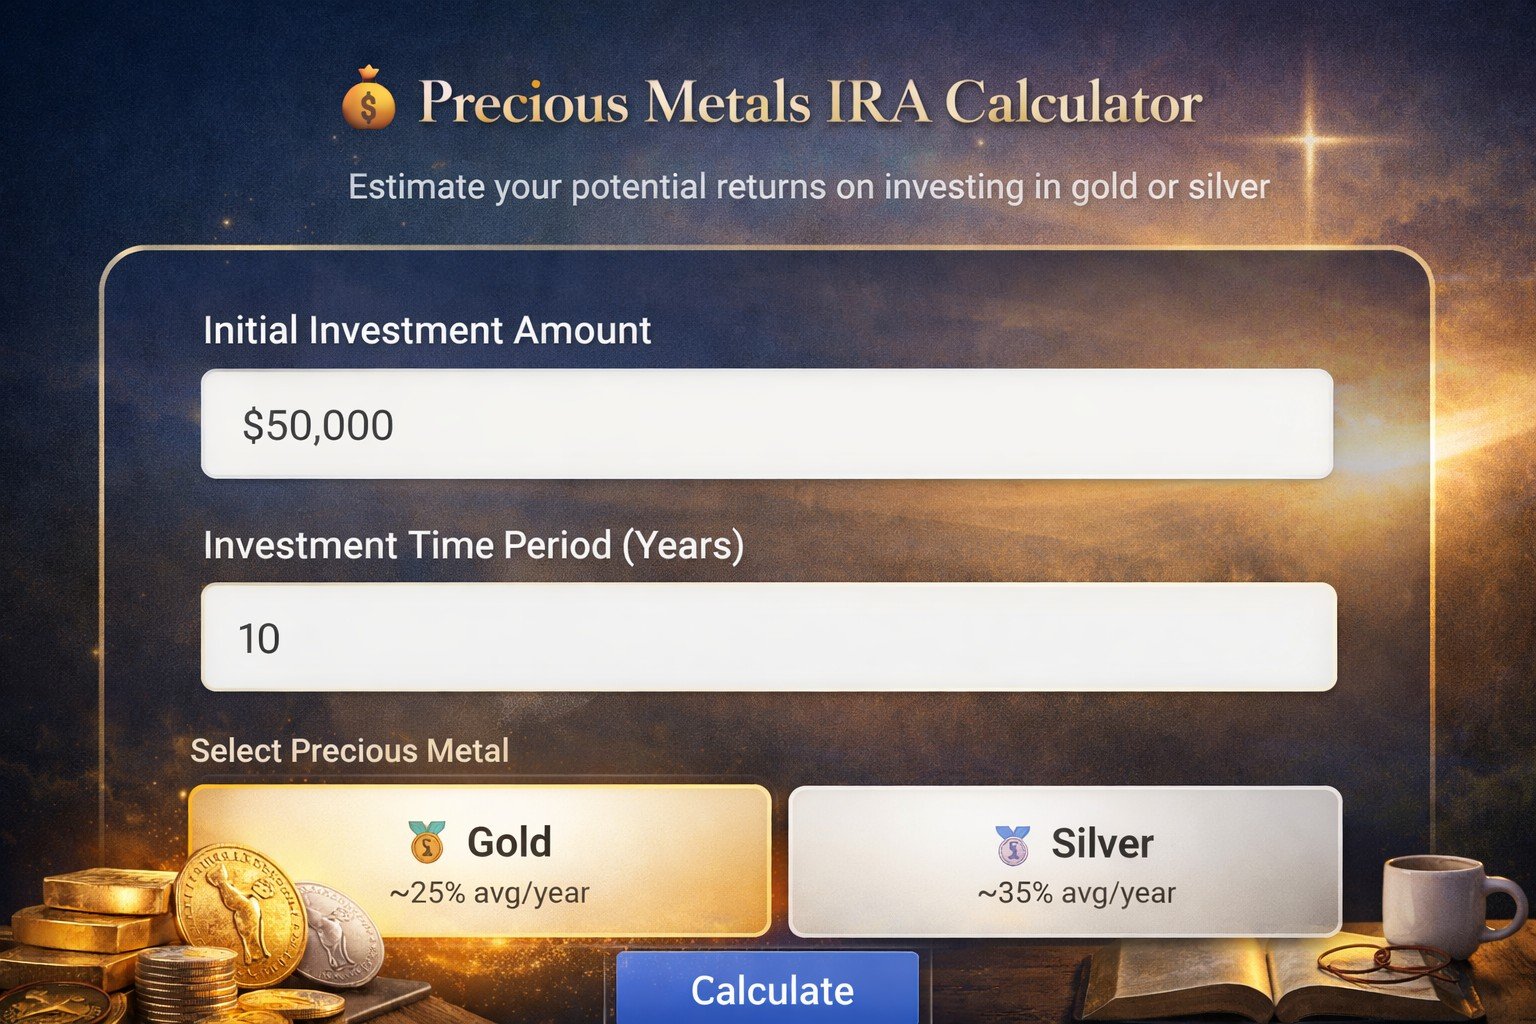
Step 1: Enter Your Initial Investment Amount
- In the “Initial Investment Amount” field (default: $50,000), type your starting amount.
- Minimum: $5,000 for direct purchases or $25,000 for IRAs. The tool will alert if it is too low.
- It auto-formats with a dollar sign and commas.
Step 2: Set the Investment Time Period
- In “Investment Time Period (Years)” (default: 10), enter or adjust the number of years (1-40).
- This affects compounding growth.
Step 3: Select a Precious Metal
- Choose from the options: Gold (~25% avg. annual return), Silver (~35%), Platinum (~18%), or Palladium (~22%).
- Click the radio button for your preferred metal.
Step 4: Choose Annual Fee Structure
- From the dropdown, select “Standard ($280/year)” or “Premium ($180/year)”.
- This accounts for typical IRA custodian and storage fees.
Step 5: Include Free Silver Bonus (Optional)
- From the dropdown, select “No Bonus”, “5% Free Silver ($50K-$99K)”, or “10% Free Silver ($100K+)”.
- This adds promotional value based on your investment size.
Step 6: Calculate
- Click the “Calculate Returns” button.
- The tool updates instantly. Changes to inputs are auto-recalculated when you update entries.
Understanding the Results
- Projected Results:
- Total Value After [Years]: Net amount post-growth and fees.
- Total Return: Gain amount and percentage.
- Average Annual Return: Compounded yearly rate.
- Fee Summary: Breaks down setup ($80), annual fees, total fees, and bonus added.
- Comparison Section: Shows your IRA vs. S&P 500 (10% avg/year) and bonds (4% avg/year), with an advantage over stocks.
- Growth Chart: Bar visuals comparing final values.
- Note Box: Reminds that estimates are conservative; consult an advisor.
Quick Tips
- Experiment with scenarios by changing one input at a time.
- Rates are averages based on recent trends—actual returns may vary.
- Use on desktop or mobile; the layout adjusts to screen size.
This tool provides quick insights but isn’t financial advice. For real investments, seek professional guidance.
Precious Metals Investment Calculator
Project your retirement portfolio growth based on 10-year historical averages
Investment Details
ℹ️ Note: Growth rates are based on 10-year historical averages. Gold: 15.2%, Silver: 18.5%, Platinum: 10.8%, Palladium: 12.3%. Past performance does not guarantee future results.
Projected Results
Projected Portfolio Value
$50,831
After 5 years in Gold
Total Gain
$25,831
+103.3%
Avg. Annual Return
15.2%
Based on historical data
| Year | Balance | Annual Gain |
|---|---|---|
| 1 | $28,800 | $3,800 |
| 2 | $33,178 | $4,378 |
| 3 | $38,221 | $5,043 |
| 4 | $44,031 | $5,810 |
| 5 | $50,831 | $6,800 |
Disclaimer: This calculator provides estimates based on historical average returns for precious metals over the past 10 years. Actual investment performance may vary significantly due to market conditions, economic factors, geopolitical events, and other variables. Precious metals investments carry risks including price volatility and potential loss of principal. The projections shown do not account for fees, storage costs, taxes, or inflation. This tool is for educational purposes only and does not constitute financial advice. Always consult with a qualified financial advisor before making investment decisions. Past performance is not indicative of future results.
Leave a Reply